Scalability
What KPIs should I track while scaling my HVAC business?
There are a lot of KPI's that could and should be tracked. Fortunately there are a few we really want to pay attention to as an HVAC shop. Its very important as well to understand that you need to track KPI's not just for the business over all, but your key verticals. One KPI that you will want t o track is your close rates. At coached HVAC shops the close-rate median is 71.9%, with the middle half of technicians between 52.6% and 83.7%.
Search this question and you will find lists of six, eight, ten, thirteen, and twenty six metrics. Most are written by software vendors, and they compete on length rather than usefulness as they want you to understand what they can track. One of the pages that ranks is about facility maintenance, tracking mean time between failures, which has nothing to do with running a residential HVAC shop. The problem is not that these lists are wrong. It is that they hand you a dashboard without telling you what any of it means, and their benchmark numbers disagree wildly with each other.
Here is why they disagree.
Focus on the most important KPI's
HVAC tends to have a few important metrics to track, and most pages talking about it to overwhelm you with far more.
CSR Booking Rate. Of the calls that reach your office, how many become scheduled appointments. This is a CSR number. When it is soft, you listen to call recordings and find where the disconnect is.
Technician Conversion Rate. Of the opportunities a technician presents, how many get sold. This is a tech number. When it is soft, you ride along and try to figure out how the technician is building trust with the customer.
Average Ticket. This is the average sold amount on opportunties that your technician goes to. This is a tech number. When it is soft, you need to ensure your team is conducted good assessments of the system, so that they are able to build great options.
Flipped/Converted Leads. Of the replacement quotes you present, how many get signed. This is a comfort-advisor or sales number, though you can have selling technicians that present system replacement options. When it is soft, you need to understand what the technician is inspecting and what information are they conveying to the customer about their system.
These have KPI's have different ways that they can be found and this causes some confusion on what you are actually tracking. That is why you will see "average close rate 65 to 75%" on one page, "presentation close rate 50 to 70%" on another, and "in-home replacement estimates convert at 30 to 50%" on a third, all presented as the same metric when they don't always lne up. A shop can book 80% of its calls, close 80% of its service opportunities, have a service average ticket of and convert 35% of its replacement quotes, and every one of those numbers can be healthy.
Pick your definitions, write them on the board next to the numbers, and make sure every person reporting a number is calculating it the same way. Half the value of tracking KPIs at all is that everyone finally agrees what they are counting.
You have to track the verticals in your business seperately
In your HVAC business it is likely you will run demand based service work, maintenance calls based on tune ups, and sell and install new systems or replacement systems. This is very normal, and a fantastic mix. However if you blend these departments together in your KPI tracking, you will find your averages all over the place as your compare them to other businesses.
Service and Maintenance is not going to convert the same or produce the same average tickets. Install is going to produce extremely high average tickets, and if those numbers are considered into your Service or Maintenance it is going massively affect how you coach your team.
Seasonality breaks the monthly comparisons
This is the HVAC-specific trap, and it catches shops in their first couple years of tracking.
While seemingly obvious your July numbers are not comparable to your April numbers. But even seasons adjust over years. Call volume, job mix, tech fatigue, and overtime all move with the weather. A close rate that drops four points in peak season may reflect techs running seven calls a day with no time to present properly, not a sales problem. A ticket that jumps in August could be related to the team having less volume to run. These are uknown in isolation but when compared to trending data display an intersting story.
Three rules keep this honest. Compare against the same month last year rather than against last month. Compare agianst the last three years of performance to get an even better distrobution cuirve. And watch per-tech trends within the season, where the weather is a constant for everyone on the board, so the differences between your people are real.
The numbers you should focus on with your technicians
Track four, per technician:
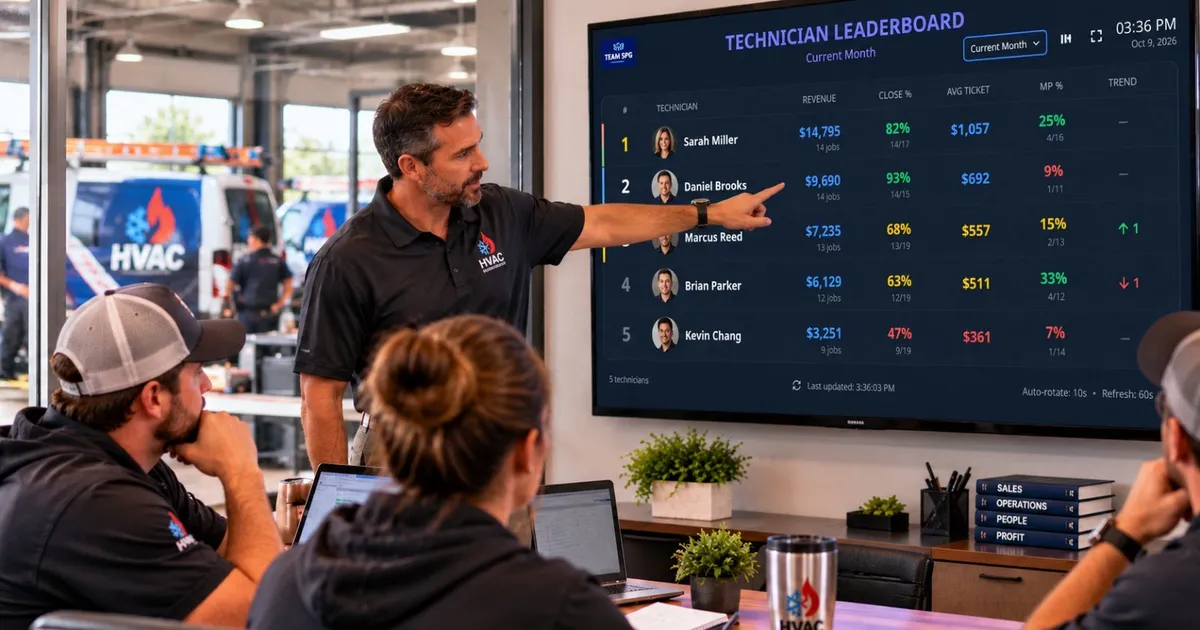
- Close rate, median 71.9% at coached shops, middle half 52.6% to 83.7%. Track per tech, daily.
- Average ticket, median $1,180, split service from replacement.
- Revenue per tech, median {{stat:hvac-revenue-per-tech-median}} a year. The rollup that catches dispatch quality and productivity together.
- Callback rate. The quality guardrail. The first three all reward selling more, and this is the one that keeps "more" honest.
Notice these come with a spread rather than a target. "Aim for a 70% close rate" tells an owner nothing about whether he is in trouble. Knowing that the middle half of coached technicians land between 52.6% and 83.7% lets you find the specific tech below the band and do something about him this week. A benchmark without a distribution is just an opinion with a number attached.
What we recommend
Start with definitions, not software. Write down what your shop means by booking rate, close rate, average ticket and flipped/converted leads, and make sure the office and the field are calculating them the same way. Half the shops we work with have two people reporting the same metric two different ways and arguing about the result.
Then track four numbers per tech, daily, on a visible board. Compare year over year, and three years if you have the data. Track each of your business verticals seperately so you exactly how your Service, Maintenance, and Sales/Install is performing.
Membership conversion belongs on this list too, and it is arguably the most important number in an HVAC business, because recurring revenue is what makes the shoulder seasons survivable and what an acquirer actually pays for when looking at your business. Track your own from today: plans offered and plans sold per tech.
To see which system is holding your shop back before you build the board, take the free scale-readiness assessment. A few minutes, no account.
52.6%
HVAC close rate (bottom 25%)
Team SPG coached-shop data · trailing 12 months ending Sep 2026 · updated Sep 2026
71.9%
HVAC close rate (median)
Team SPG coached-shop data · trailing 12 months ending Sep 2026 · updated Sep 2026
83.7%
HVAC close rate (top 25%)
Team SPG coached-shop data · trailing 12 months ending Sep 2026 · updated Sep 2026
$1,180
HVAC average ticket (median)
Team SPG coached-shop data · trailing 12 months ending Sep 2026 · updated Sep 2026

Related questions
What is a good close rate for an HVAC company?
The coached-shop median is 71.9%, with the middle half of technicians between 52.6% and 83.7%. Make sure you are comparing close rate to close rate, though. If the number you are holding is calls that became appointments, that is booking rate and it is not comparable.
What is a healthy revenue per technician?
{{stat:hvac-revenue-per-tech-median}} a year at the median for coached shops, counting revenue from work performed divided by producing technicians. Lower figures you find elsewhere are often per employee or per truck.
How often should I review HVAC KPIs, weekly or monthly?
Collect daily, review weekly, and act monthly. Daily collection is the part that makes the weekly review trustworthy. Monthly collection is archaeology.
What is the difference between booking rate and close rate?
Booking rate is inbound calls that become appointments, and it belongs to your CSR. Close rate is presented opportunities that become sold work, and it belongs to your technician. Different denominators, different people, different fixes. Most published HVAC benchmarks blur the two, which is why they contradict each other.