

Free software for the trades
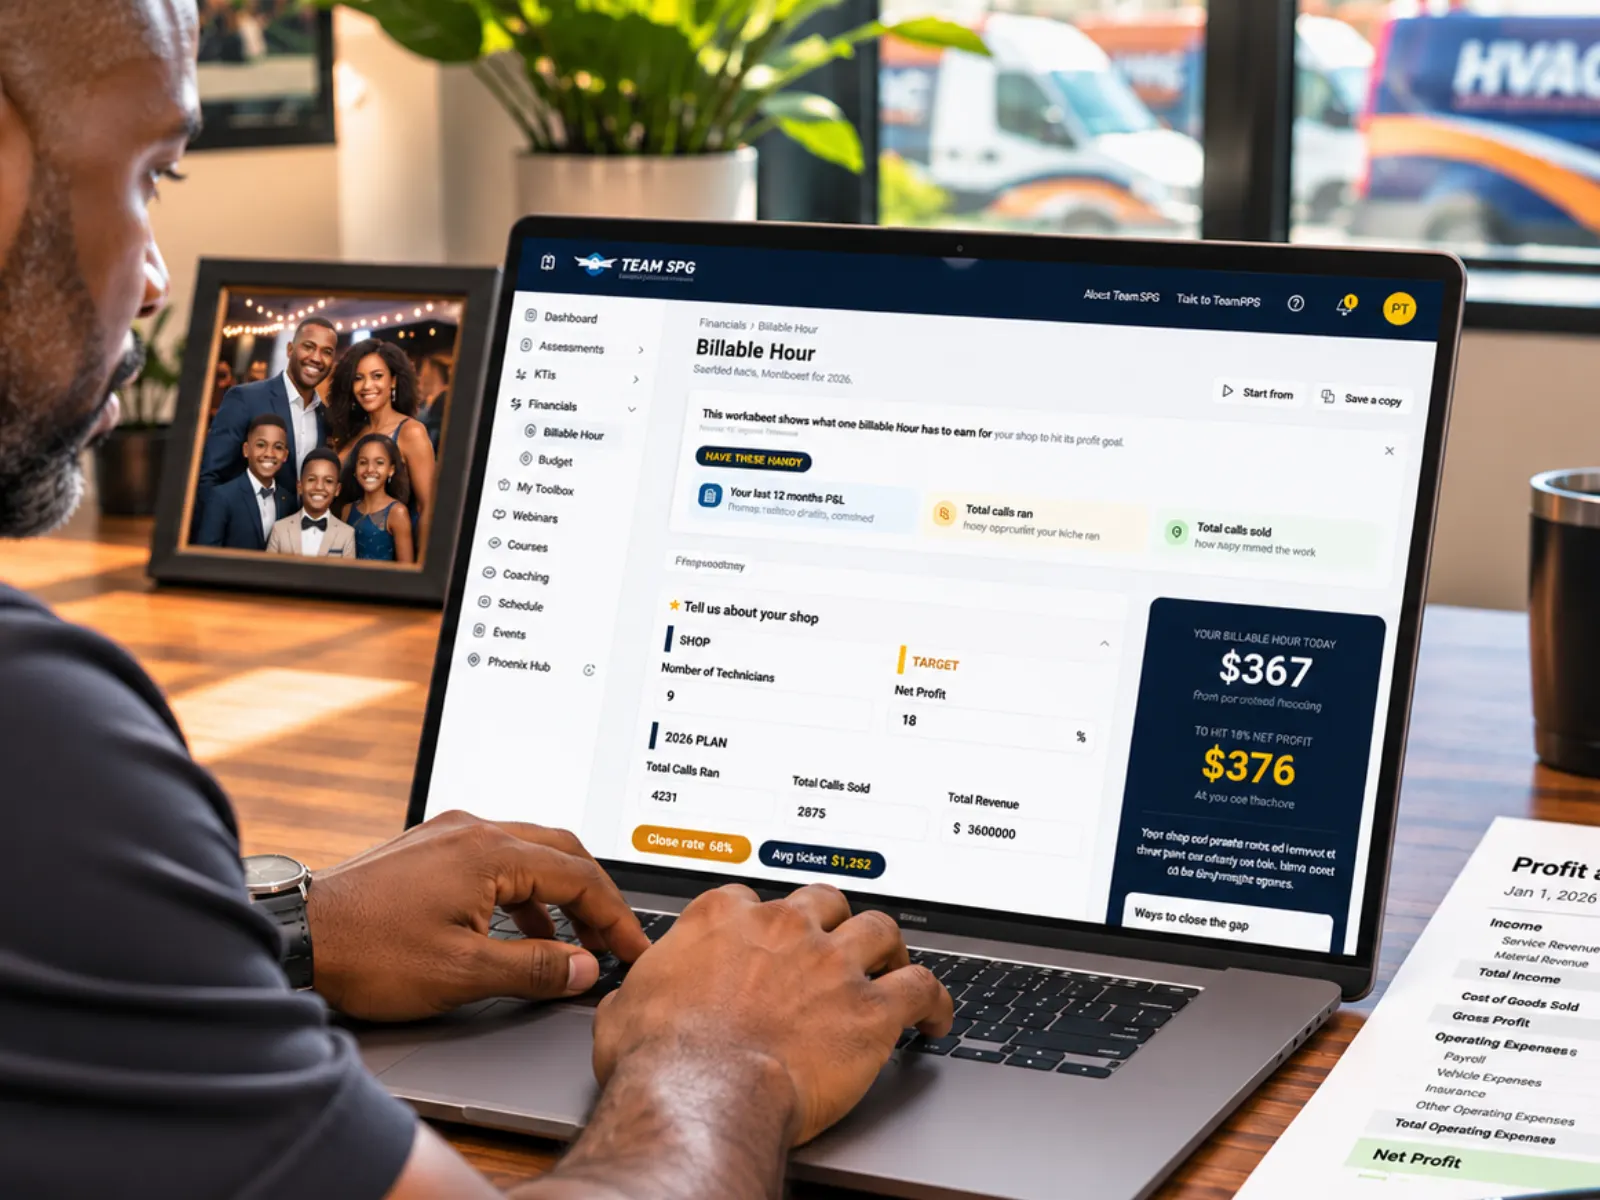
Enter your revenue, costs, technicians, and calls. The worksheet shows the rate one billable hour has to earn to hit your profit goal, and what to change if your shop cannot get there yet. It is free.
Free forever. No credit card. No coaching contract.
Why it works
Every dollar of overhead has to be paid for by the hours a customer is billed for. The worksheet spreads all of it across those hours and tells you the rate. Then it tells you whether your shop can produce enough of them.
Most owners set a rate by looking at competitors. The worksheet builds it from your own revenue, costs, headcount, and profit goal, so the number is yours.
Add a technician. Raise the marketing line. Move the profit goal. The rate moves while you watch, so you can tell what each decision costs before you make it.
If your close rate or average ticket is below your trade, the report says so first. Coaching your techs is often worth more than a price change, and you find that out here.
The report
The gap between Break Even and Selling Price is how much room your price really has. Under the hours, the report shows per-tech targets: the calls and sales each technician has to produce every day, month, and year for the plan to work.
The worksheet
Tell us about your shop: technicians, calls ran, calls sold. Then revenue, each cost line, and the profit you want to keep. Headcount and calls fill in from your KPIs when you have them, so you are checking numbers, not hunting for them.
Change any figure and the rate moves with it. Start from puts everything back to blank, or, with SOS Pro, to a worksheet you saved earlier. The line under the title always says what you started from.
Capacity reality check
A rate is only a number if your trucks cannot bill enough hours at it. The report checks your goal against the hours your team can produce and shows the gap, with concrete ways to close it.
When your close rate or average ticket is below your trade, the report leads with Fix your technician KPIs first, and tells you whether coaching the team to the top quarter closes the gap on its own. When your team's numbers are healthy, it leads with a combination plan instead: a little more price, a little better close rate, a little less spending.
Against your trade
When Team SPG has published benchmarks for your trade, your close rate and average ticket turn red or amber if they fall below the typical range. A block under them shows where your close rate, average ticket, and revenue per tech each sit, from the top ten percent to the bottom quarter, and what lifting each one is worth in dollars per year.
A below-average flag is a training signal, not a verdict. Open KPIs to see who to start with.
Getting started
Financials, then Billable Hour. Headcount and calls fill in from your KPIs when you have them. If you tried the worksheet on teamspg.com before signing up, your numbers are already loaded.
Revenue, each cost line, technicians, calls ran, calls sold, and the profit you want. The report on the right fills in as you type.
Move one figure and watch the rate. Then put it back. That is how you learn what each line is worth. SOS Pro members can save a named copy of any version.
Changes save on their own as you type. Nothing you do here touches your Budget.Read the guide in the Help Center.
When you have the rate
The worksheet tells you what an hour has to earn. The Budget is where you plan the year: every revenue and cost line, with the same general ledger codes as your books, and your actuals next to the plan as the months close.
The worksheet shows the rate. The budget is how you get there. Both are free to build.
The Billable Hour worksheet is free. So is the rest of SOS: KPIs, goals, the TV Leaderboard, the budget grid, assessments, starter courses, and a login for every person on your team. Saved worksheet copies are part of SOS Pro.
Yes. The worksheet and the full report, including the three billable hours, the capacity check, and the benchmark comparison, are part of the free level of SOS. Saving named copies of the worksheet and loading them back is part of SOS Pro.
An hour a technician spends on a job that a customer pays for. Driving, shop time, training, and callbacks are paid hours but not billable hours. The worksheet works out how many billable hours your team can produce and spreads your costs and profit goal across them. That is the rate.
Because a low close rate or a thin average ticket is usually the bigger problem, and you can fix it without touching your price book. When your team is below average for your trade, the report shows what coaching them to the top quarter is worth on the calls you already ran. If that covers the gap, it says so. If it covers part of it, the price and spending moves are sized for what is left.
From shops Team SPG coaches. When benchmarks are published for your trade, your close rate and average ticket chips turn red or amber if they fall below the typical range, and a block under them shows where your close rate, average ticket, and revenue per tech each land. They are shown as ranges, not exact targets.
No. The worksheet is a scratchpad. Nothing you type here touches your Budget. When you have the numbers you want, open Financials, then Budget, and enter the plan there line by line.
Yes. There is a public version of the worksheet on teamspg.com that needs no login. When you create a free account, the numbers you typed there come with you.

Free software for the trades
Create your free account, open the worksheet, and type in last year. In twenty minutes you will know what an hour has to earn and whether your price book is anywhere close.
Create your free accountFree forever. No credit card. No coaching contract.