

Free software for the trades
SOS tracks technician KPIs and CSR KPIs in one place: close rate, average ticket, maintenance plans, callbacks, and booking rate. Every number turns green or red against the goal you set. It is free.
Free forever. No credit card. No coaching contract.
Why it works
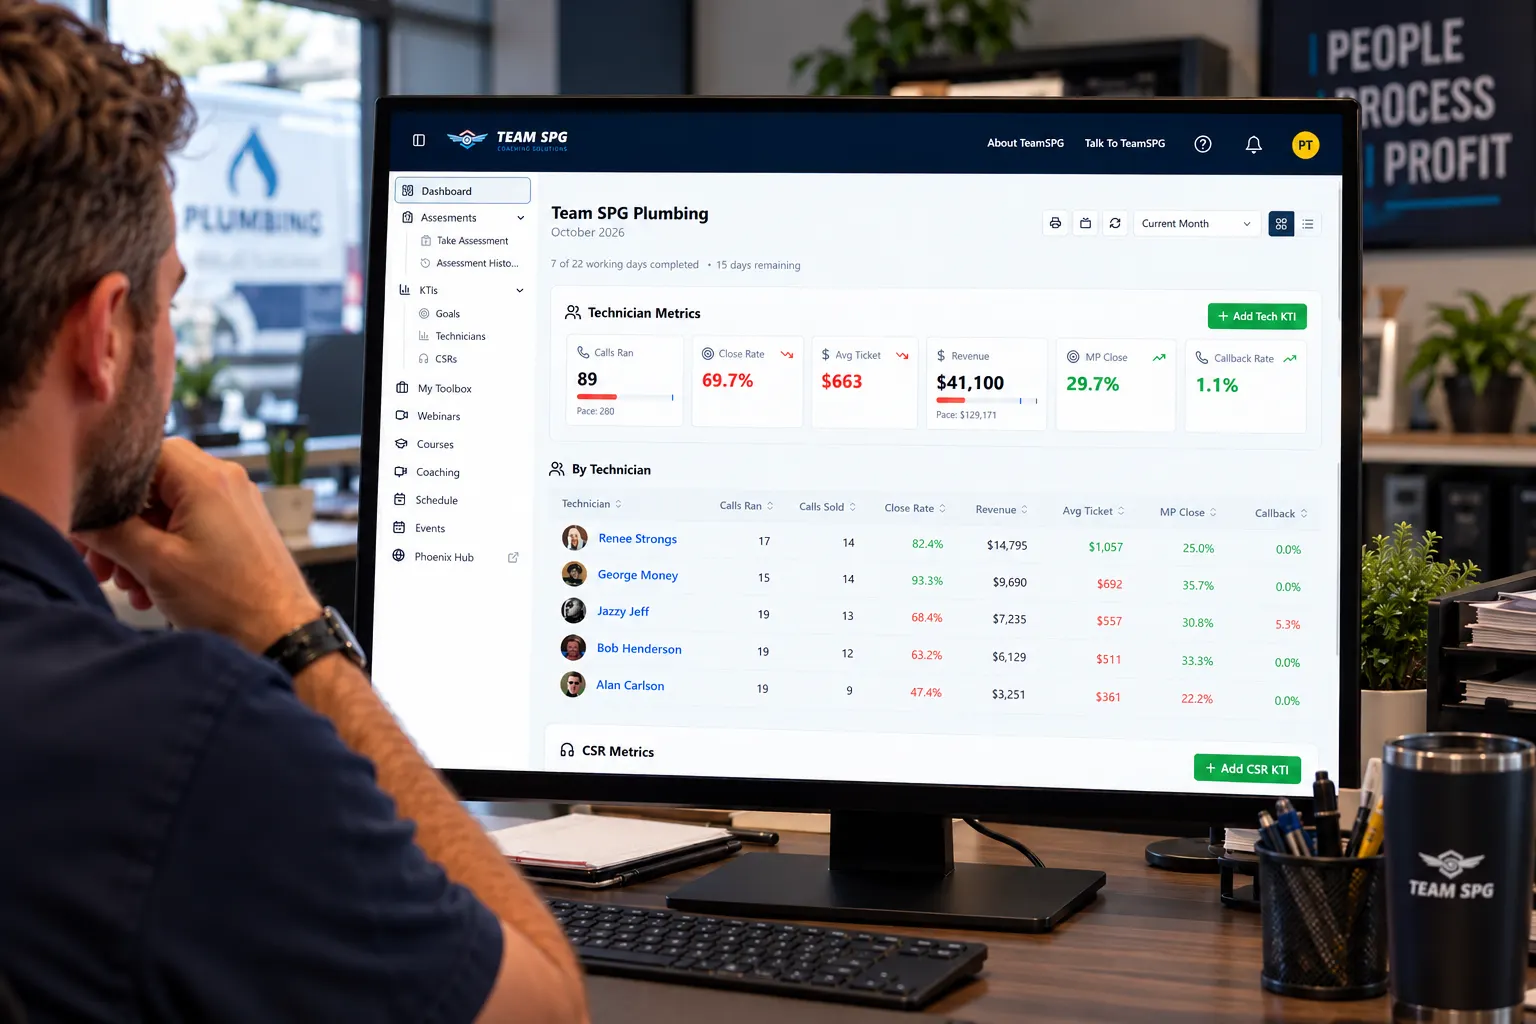
Most shops know their total revenue and almost nothing else. Break that total down by technician and you have accountability and actionable data. One tech is closing the calls and leaving money on the table. Another is selling big jobs and losing the small ones. Same revenue, two very different training needs.
Two techs can bring in the same revenue and be good at completely different parts of the job. The numbers tell you what to work on.
Numbers go in daily or weekly, so a tech has immediate accountability. A monthly report tells you about it after the month is gone.
Every tech and CSR sees the same numbers you see. The conversation moves from whether the number is right to what to do about it.
For the trucks
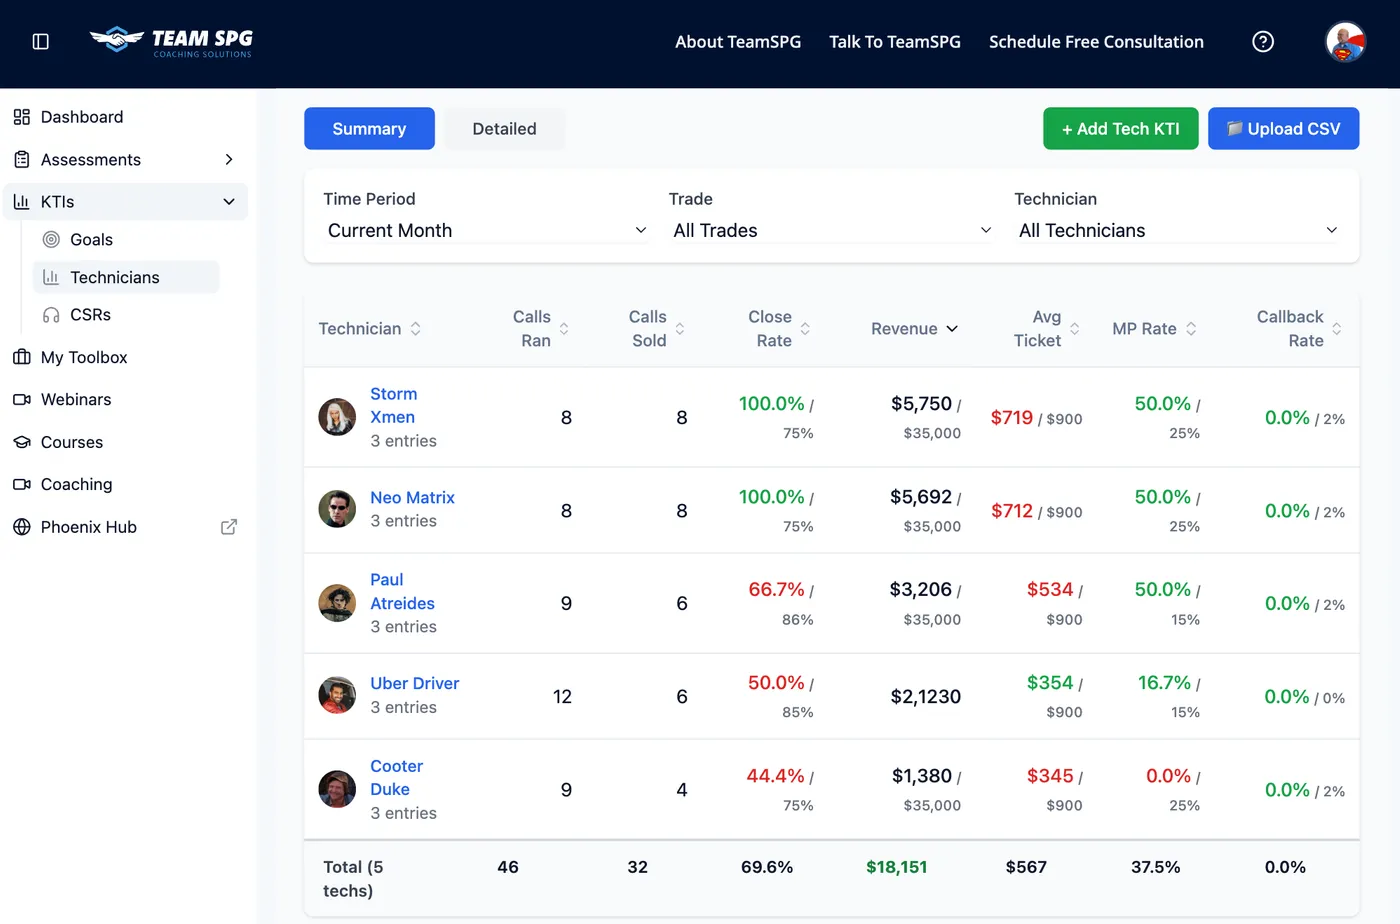
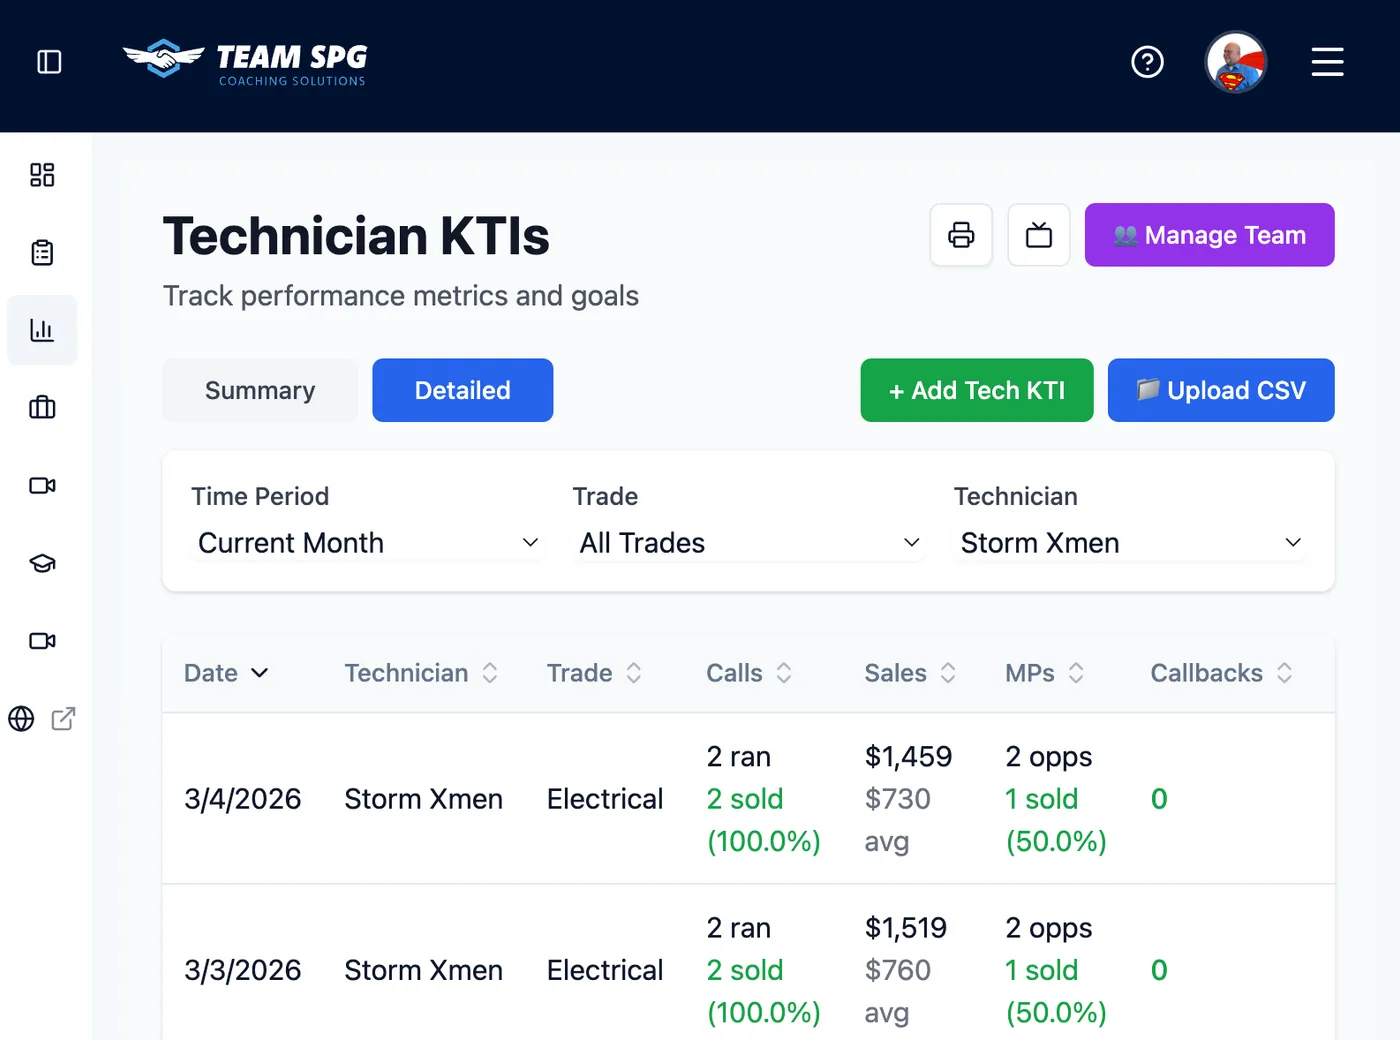
Sort by any column to see who is at the top and who is at the bottom. Filter by trade so your plumbers are compared with your plumbers. Click a technician to open his own card, with every entry behind the number and the history of how it changed.
For the front office
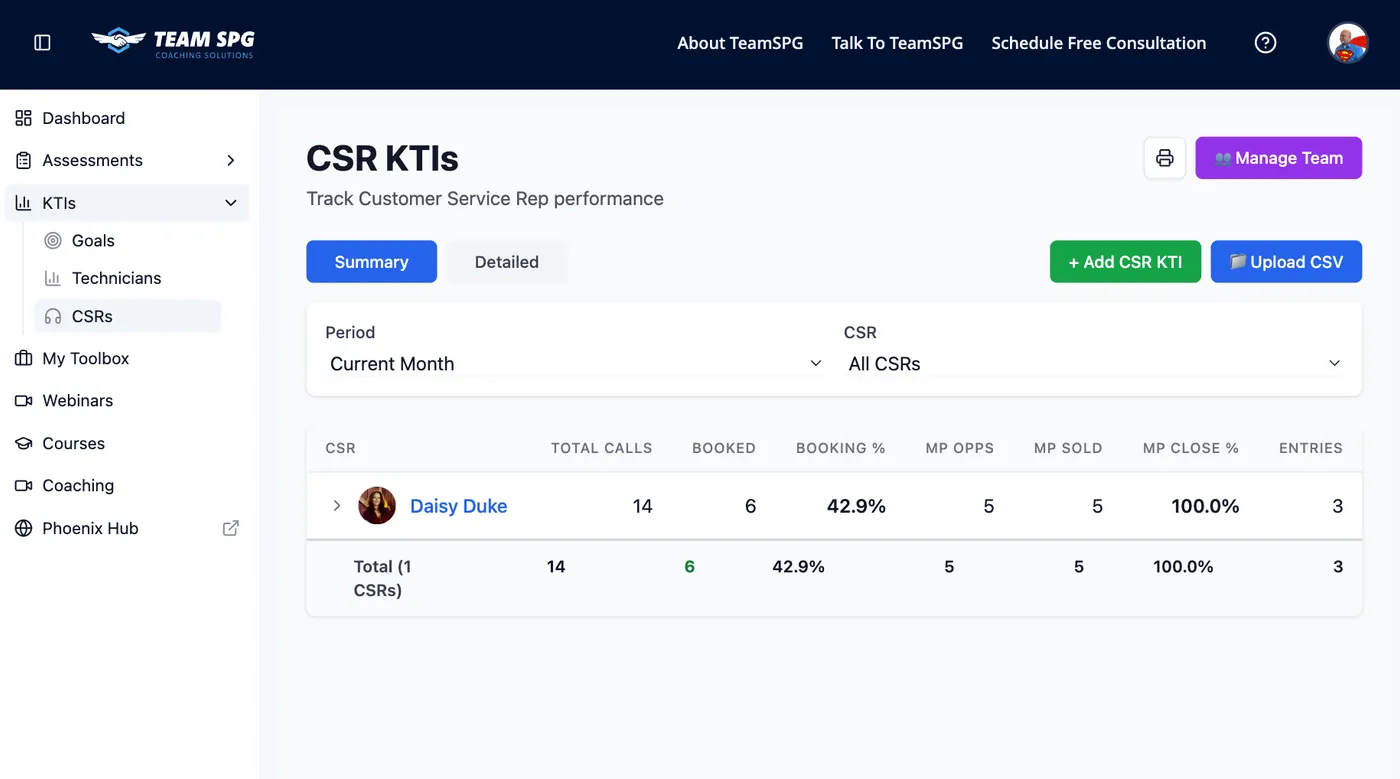
A CSR (customer service rep) decides how many of your calls turn into jobs before a truck ever leaves the shop. That work needs its own scoreboard, not a line on the technician report.
Inbound and outbound calls are tracked separately, so a CSR who is good on the phone with a customer who called in and quiet on callbacks out has somewhere to improve.
Green or red
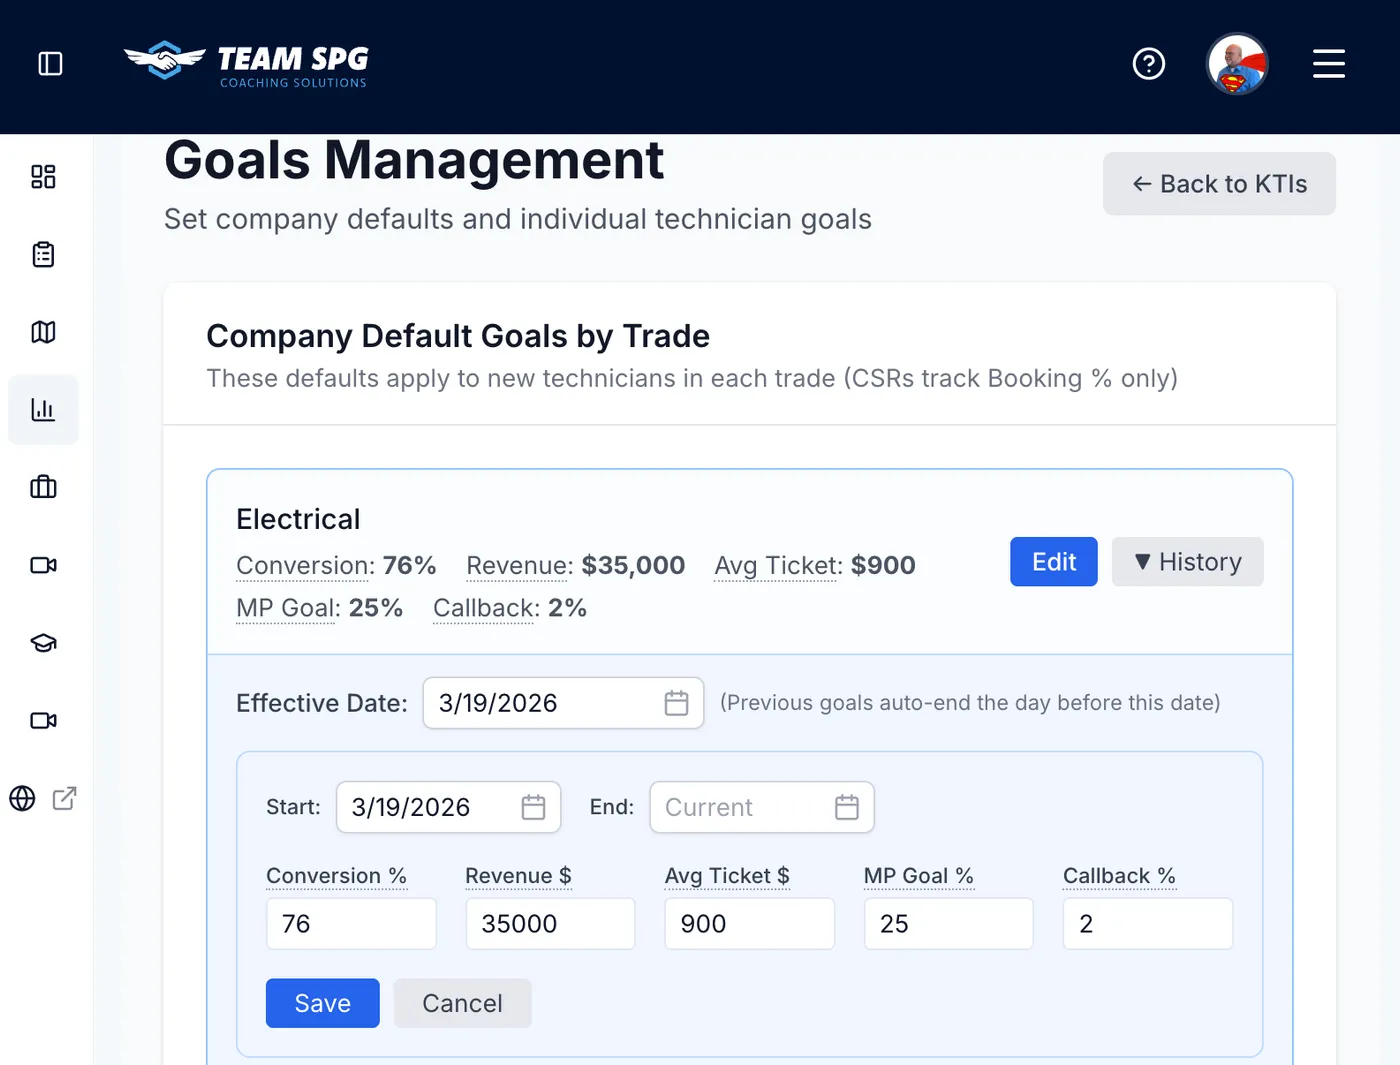
Set a close rate, revenue, average ticket, maintenance plan, and callback target for each trade. Your HVAC goals and your plumbing goals can be different numbers, because they are different jobs. CSRs get their own targets for booking rate and maintenance plans, split between inbound and outbound.
Every number on every screen then shows green or red against that target. You stop reading tables and start looking for red.
Goals have an effective date, so raising the bar in March does not make January look like a bad month. Your Team SPG coach can help you set targets that fit your market.
Getting the numbers in
Open Add KTI, pick the technician and the date, and type in the numbers. Works on a phone or a computer.
Download the template, fill it in, and upload the CSV (a spreadsheet file). Good for catching up a whole week at once.
Export the numbers you already have and upload them the same way. You do not have to switch software to use SOS.
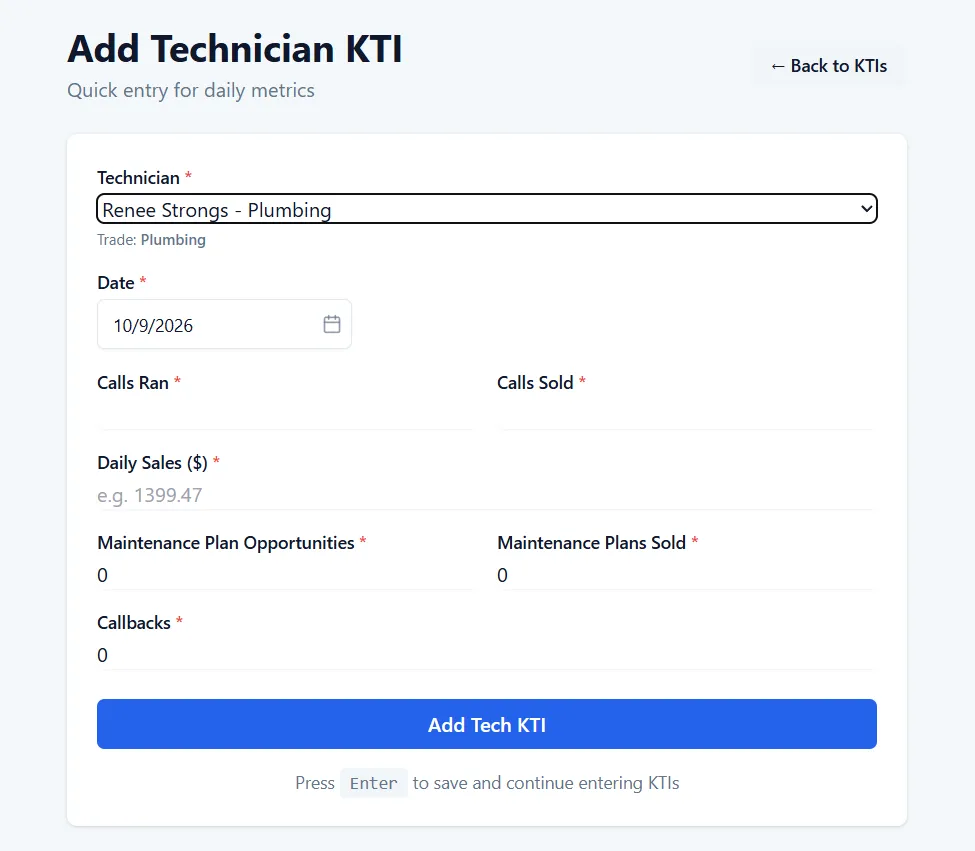
Entry takes a service manager a few minutes a day. Pick any period to look at: month to date, last month, year to date, the last 30 days, or your own date range.Read the setup guide in the Help Center.
Same numbers, bigger screen
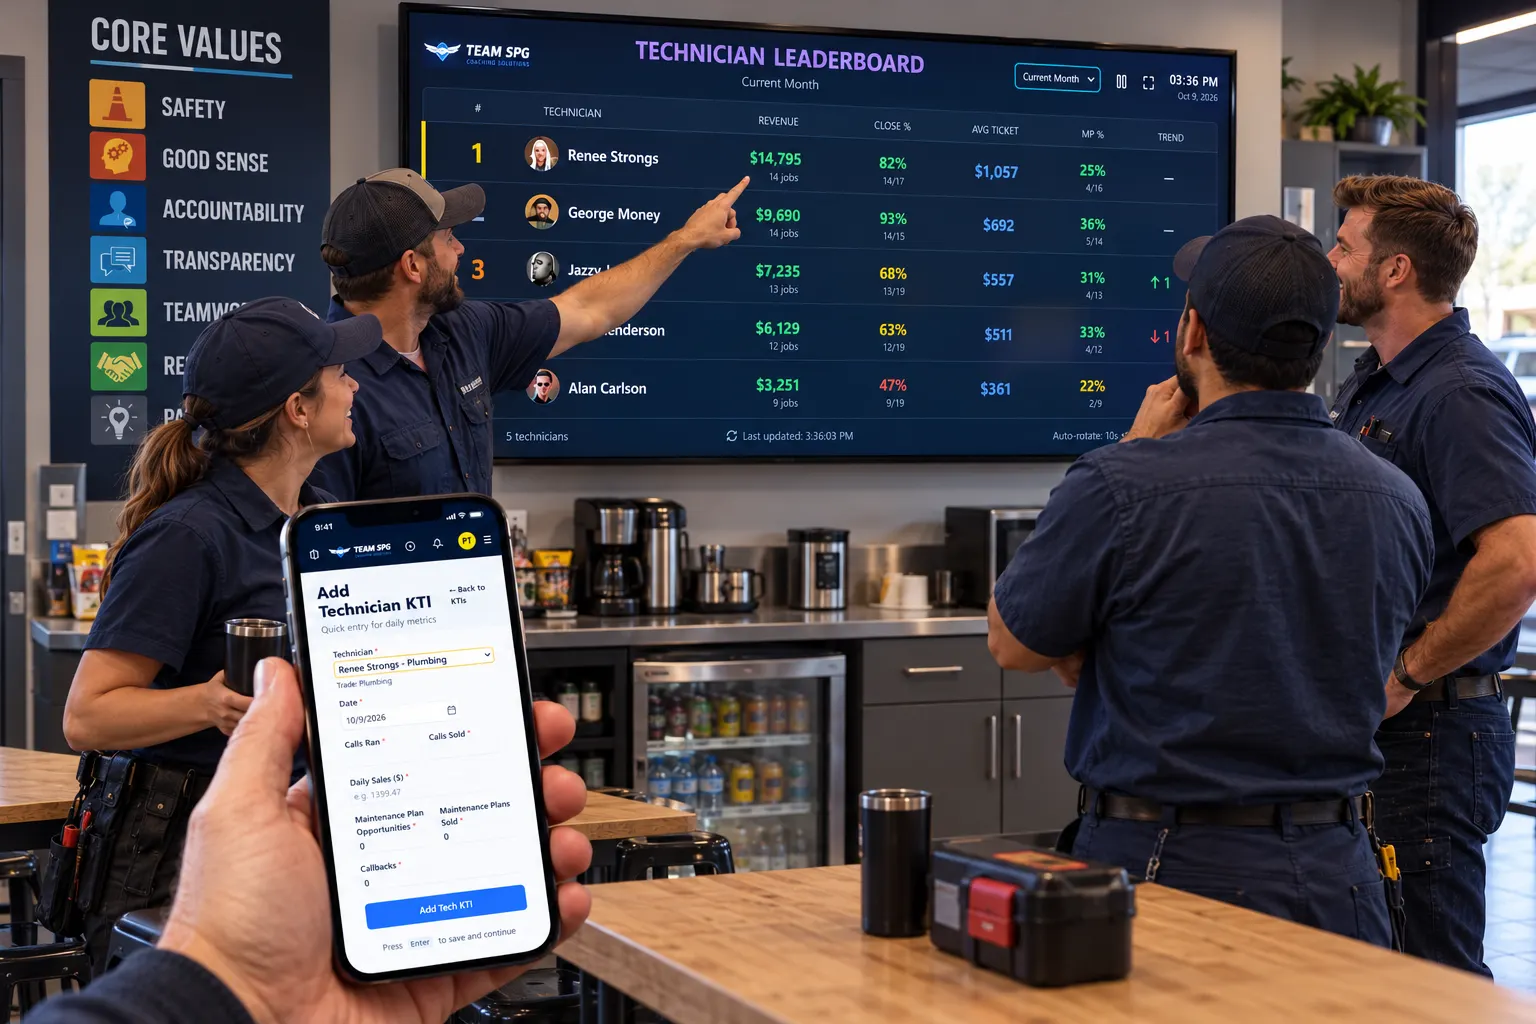
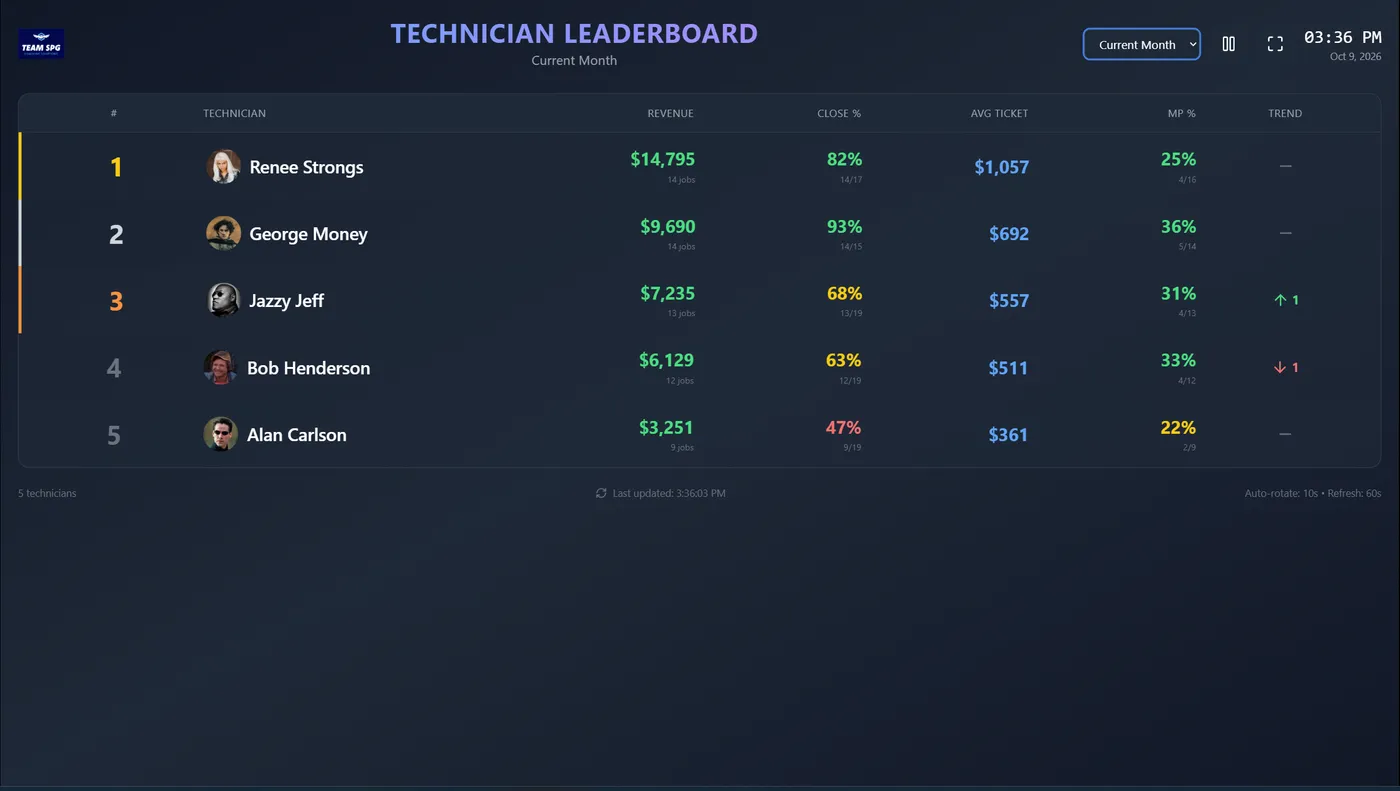
The numbers you enter here are the numbers the TV Leaderboard ranks. Pair any TV with a browser and your techs see where they stand every day, without you saying a word.
The board shows the score. These pages show the reason behind it. Both are free.
KPI tracking is free. So is the rest of SOS: goals, the TV Leaderboard, assessments, starter courses, and a login for every person on your team.
KPI stands for key performance indicator, which is any number a business watches. Inside SOS you will see KTI, for Key Training Indicator. It is the same set of numbers, named for what we do with them: every one of them points at something you can train. Close rate, average ticket, and maintenance plan rate all move when a tech gets better at the service call.
Yes. Technician KPIs, CSR KPIs, goals, the TV Leaderboard, assessments, and starter courses are all part of the free level of SOS. Every technician, CSR, and manager gets their own login at no cost. There is no credit card and no time limit.
No. Most shops type the numbers in, or upload a CSV file exported from the software they already run. There is nothing to install and nothing to integrate before you can start.
Daily is best, because a tech can fix this week while the week is still happening. Weekly works. Monthly turns the whole thing into a report, and nobody gets trained off a report.
Yes. Each person gets a login. Technicians and CSRs see their own numbers against their goals. Managers see their team. Owners see everyone.
Yes. CSR numbers break down into inbound and outbound, and you can set a separate booking goal and maintenance plan goal for each. Expand a CSR row to see the split.

Free software for the trades
Create your free account, add your techs and CSRs, and enter this week. By Friday you will know who to ride along with on Monday.
Create your free accountFree forever. No credit card. No coaching contract.