KPIs
What goes on a technician scorecard?
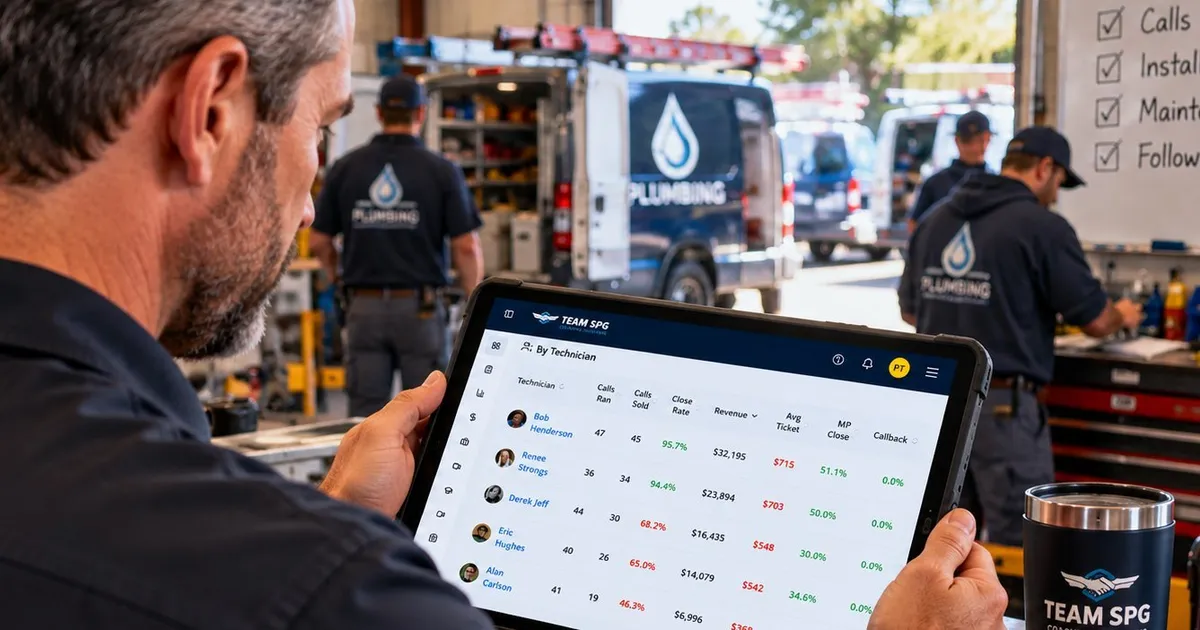
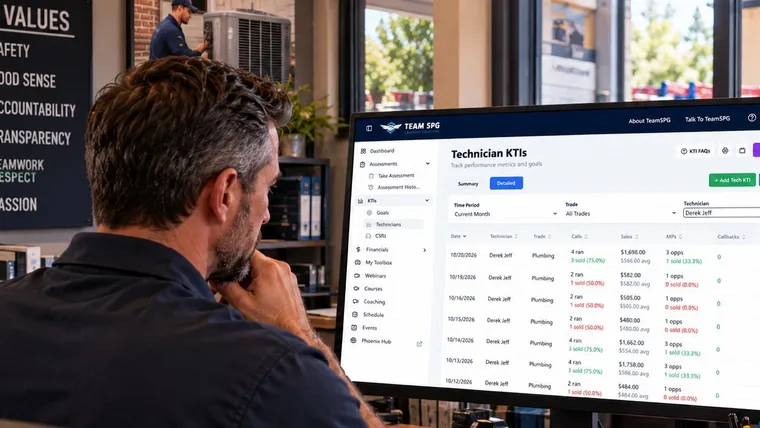
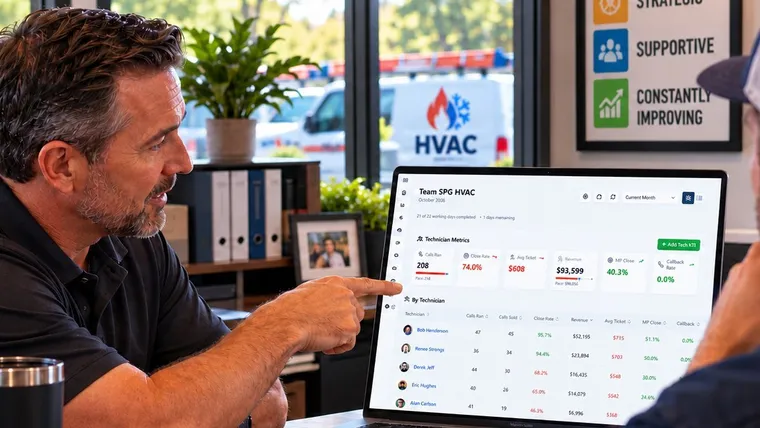
A technician scorecard has seven numbers. Two are given to him, four show what he did with them, and one shows the results.
What dispatch gave him
- Calls ran
- Maintenance plan opportunities
What he did with those calls
- Close rate (calls sold divided by calls ran)
- Average ticket (revenue divided by calls sold)
- Maintenance plan close rate (plans sold out of chances)
- Callback rate (jobs needing a return trip)
The result
- Revenue
A sales scorecard for reps counts dials and demos instead. SOS from Team SPG builds the technician version for free.
Why a sales scorecard for reps does not fit a tech
Every sales scorecard template online has the same shape. Leading numbers on the left: calls made, emails sent, meetings booked, demos run. Lagging numbers on the right: deals closed, win rate, deal size, quota. Two to five of each, reviewed weekly. That shape is right. The numbers inside it are wrong for a shop.
A rep controls his activity. He can make more calls. A tech cannot. Dispatch decides how many calls he runs and which ones. If you score a tech on activity, the tech with the busiest route wins every month and nobody learns anything.
So the technician scorecard keeps the shape and swaps the numbers. The left side is what dispatch handed him. The right side is what he did with it.
The seven numbers, sorted
What he was given
- Calls ran. The opportunities he was sent on.
- Maintenance plan chances. The calls where a plan could have been offered.
What he did with them
- Close rate. Calls sold divided by calls ran. The first number to read when revenue is low.
- Average ticket. Revenue divided by calls sold. This is where a full assessment and more than one option show up.
- Maintenance plan close rate. Plans sold out of the chances. Plans fill next year's schedule.
- Callback rate. Jobs that needed a return trip. Lower is better.
The result
- Revenue. The number the paycheck follows. It is on the card because the tech cares about it, not because it tells you what to train.
Inside SOS these are called KTIs, for Key Training Indicators. They are KPIs, named for what you do with them. Each one points at a part of the service call. That is why calls sold is on the card as a count but is never the number you coach to. Close rate is.
What each number tells you to train
The card is useful because each red cell points at a specific part of the call.
Close rate low with a good average ticket. The tech is losing the customer early, before the work talk. He is not asking enough questions, not building a relationship, not explaining what he is about to do, or not showing value before the price. Train the opening: the introduction, relationship questions, the job explanation, objection handling.
Good close rate and low average ticket. He is closing but fixing only the one thing he was called for. Did he skip the full assessment? Check if he presented one option instead of three. Does he not believe in the price? Train a complete performance and safety assessment on every call and three options every time: upgrade, prevent, replace.
Both low. Stop wasting calls. Ride along with the technician this week instead of reading the card again. Watch the call without stepping in, then debrief.
Maintenance plan close rate low. It usually moves on its own. The tech can close well and never bring up the plan, because he does not see the value himself. Train the value to the customer first, then to the tech, then to the company.
Callbacks up. A quality number. Look for a pattern in the type of job before you decide it is the tech.
Before you pick the training, ask whether the problem is skill, mindset, or missed opportunities. A tech who cannot present three options needs practice. A tech who can and skips it because he fears objections needs a different conversation.
Counting rules that keep the card honest
Most incorrect scorecards are from rules and data entry. Agree on these before starting to enter your numbers.
- A job is sold on the day it is finished. Not the day the deposit is taken. Deposits never go on the card.
- A multi-day job is one call ran and one call sold, on the last day. A job that starts in one month and finishes in the next counts in the second month.
- A job sold on a follow-up visit counts twice. A call ran with no sale on the first day, and a call ran with a sale on the day it closes.
- Two selling techs on one job: each gets a call ran, the lead tech gets the sale and all of the revenue. Splitting it ruins both average tickets. The point is to see how often two selling techs went where one would do.
- Helpers, apprentices, and install crews are not on the technician card.
- A real callback is one call ran, no sale, and one callback against the original tech. If the return visit was not his fault and he sells more work, count it as a normal call.
- A tech in two departments gets a card in each, with that department's goals.
Compare him to his goal and his own last month
A salesperson scorecard on a sales floor compares every rep to the same quota. A technician scorecard should not. Compare the tech to two things: the goal for his trade, and his own history.
The goal comes first. In SOS you set a close rate, revenue, average ticket, maintenance plan close rate, and callback target per trade. HVAC goals and plumbing goals are different numbers, because they are different jobs. Each cell on the card turns green or red against that goal.
His own history comes second. Open the tech's card and the period selector gives you month to date, last month, year to date, and the last 30 days. Look at four weeks, not one day. A tech whose close rate moved up over three months is improving even if he is still in red. A tech whose average ticket dropped since last month needs a one-on-one to understand why, even if he is still in green.
A sales rep scorecard template vs the SOS card
The sales rep scorecard templates you can download are spreadsheets with weighted scores. You decide that calls are worth so many points and demos so many more, and the sheet adds it up. Points hide the real numbers. A tech should be able to look at his card and know his close rate without doing math.
The SOS card does not weight anything. It shows the seven numbers, green or red, with every entry behind them and the history of how each one moved. The by technician table above it is the sales team scorecard for the shop, sorted by any column, filtered by trade. Click a name and his card opens.
Nothing connects to it. The owner or service manager enters six numbers per tech per day, by hand or from a CSV upload. If you run field service software, export the same columns and upload that file.
Who keeps the score, and the weekly review
On a sales floor the CRM is the sales scorekeeper. In a shop it is the service manager. Not the tech, and not the dispatcher between calls. One person enters the numbers from the closed tickets at the same time every day.
Then the manager spends five minutes a day looking for red and for numbers that jumped. Once a week he picks one tech for a one-on-one. Not always the worst one. Someone inconsistent, or trending down, or ready for a push.
The one on one has four parts. Recognize something first, even in a bad month. Review last week's goal, and let the tech talk before you do. Set one goal for one week, written as a behavior he can repeat on every call, and say why it matters. Then put the follow-up on the calendar.
Match the goal to what the card says. Inconsistent numbers get "run the full call process on every call this week." A low close rate gets "ask five relationship questions on every call." A low average ticket gets "present all three options on every visit, even when the customer seems hesitant." A tech who has checked out gets something that builds ownership, like leading one morning huddle.
The KPIs page shows the card with real columns. Create the free account, add your techs, and enter this week.

Related questions
How many numbers should be on a technician scorecard?
Seven, and no more. Calls ran, calls sold, close rate, revenue, average ticket, maintenance plan close rate, callback rate. If you want to add one, take one off first. A card with twenty numbers gets read by nobody.
Should I review the scorecard weekly or monthly?
Enter daily or weekly. Review weekly with the tech, looking at his last four weeks. Use month to date and year to date when you set goals. Monthly review alone is too slow. By the time you see the problem, the month that caused it is over.
Should the scorecard be public?
The card is for the tech and his manager. The ranking can be public when you are ready for it. The [TV Leaderboard](/sos/leaderboard/) shows revenue, close rate, average ticket, and maintenance plan rate on the shop TV. It leaves callbacks off the wall on purpose.
What about CSRs?
They get their own card. Leads, booked, booking rate, maintenance plan chances, and plans sold, split inbound and outbound. The [shop dashboard article](/sos/kpis/business-dashboards/) covers both halves of the screen. <!-- CTA component: sos (id: sos-signup), utm_campaign=sos-kpis. Set as the per-article override at import. Internal links: pillar /sos/kpis/; siblings /sos/kpis/business-dashboards/, /sos/kpis/employee-performance-tracking/ (link once published); feature /sos/leaderboard/. The electrical close-rate/average-ticket diagnosis article is unpublished (registry_id TBD); link it here when it goes live. Source material: Technician KTI Analysis FAQ (counting rules), Technician KPI course, Service Manager Essentials lessons 2 to 4. Paraphrased. No downloadable scorecard is offered; Phil decides at review. No benchmark stats; stats_used stays empty unless a token is added. -->