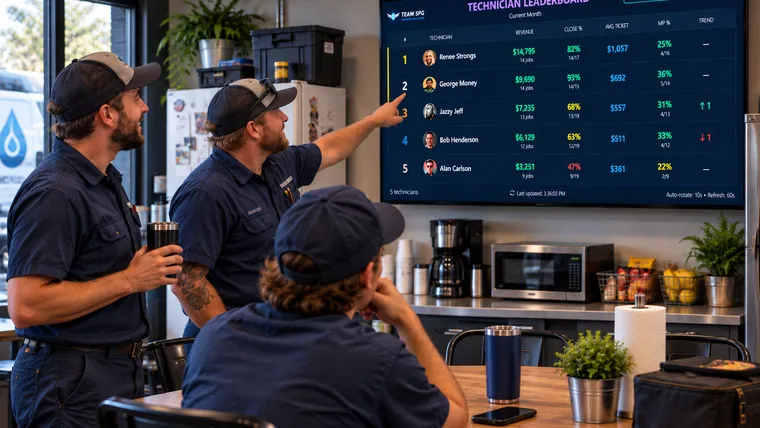
TV Leaderboard
What numbers should a technician leaderboard show?
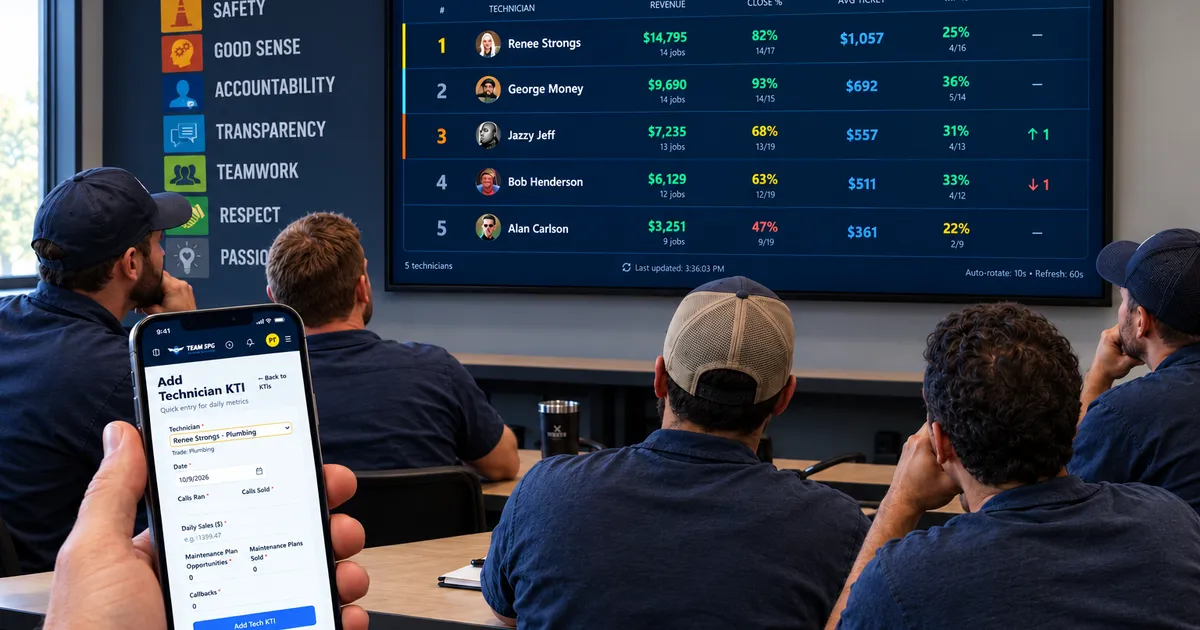
A technician leaderboard should show five numbers: revenue, close rate, average ticket, maintenance plan rate, and a trend arrow. Rank by revenue, but read close rate and average ticket to see who sells the job right. The TV Leaderboard in SOS Lite shows these five, grouped by trade, for free. A sales leaderboard dashboard for reps tracks calls and emails instead.
Why a sales leaderboard dashboard for reps shows the wrong numbers
Most leaderboard tools were built for a sales floor. A sales leaderboard dashboard ranks reps by calls made, emails sent, demos booked, and deals closed. Those are the numbers a rep controls from a desk.
A tech does not sit at a desk. He runs the calls dispatch gives him, and the number of calls is not up to him. If you rank techs by calls ran, the tech with the busiest route wins every month and nobody learns anything.
A technician leaderboard has to show what the tech does once he is in the house. Did he sell the job? How big was the ticket? Did he offer the maintenance plan? Those are the numbers that change when a tech gets better, and those are the numbers that belong on the wall. They are the same five numbers whether you run a plumbing, HVAC, or electrical shop.
The five numbers, and what each one tells you
Revenue. Total sales for the period, with jobs sold underneath. This is the number the tech's paycheck follows, so it is the number to rank by. If the board ranks by anything else, techs will argue with it.
Close rate. Calls sold divided by calls ran. This is the first number to read when a tech's revenue is low. A tech at 40% is leaving six of every ten calls without a sale. That is a training problem, not a lead problem.
Average ticket. Revenue divided by jobs sold. Two techs can close the same number of calls and bring home very different revenue. The one with the higher ticket is giving the customer more options and asking for the bigger job. The number itself looks different by trade. An electrical service ticket and an HVAC repair ticket are not the same size, which is one reason the board ranks each trade on its own.
Maintenance plan rate. Plans sold divided by plan opportunities. Plans are next year's revenue. A tech who closes well but never offers the plan is costing you the second call.
Trend. An arrow showing who moved up or down since the last period. This is the number the techs watch most. A tech in fourth place who moved up two spots is more motivated than a tech in second who dropped one.
Five numbers fit on one TV screen at a size a tech can read from across the break room. Six do not. If you want to add a column, take one away first.
Rank by revenue, coach by close rate
Revenue decides the order. Close rate and average ticket tell you why the order looks the way it does.
Say two plumbing techs each ran 60 calls this month. One closed 48 of them with a $900 average ticket. The other closed 30 with a $1,400 ticket. Their revenue is close, so they sit next to each other on the board. The first one needs to learn to present the bigger job. The second one needs to learn to close the small one. Same rank, different ride-along.
That is why the board needs all five numbers and not just the ranking. The rank gets the tech's attention. The other columns tell you and him what to work on.
What to leave off the board
Callbacks. Track them and set a goal for them. Do not put them on the wall. A callback column turns the board into a list of who made mistakes, and techs stop looking at it. Handle callbacks one on one.
Calls ran by itself. Dispatch controls this number, not the tech. It belongs inside close rate, not in its own column.
Pay or commission. The board is public. Pay is not.
Points. Generic sales gamification dashboard tools let you give points for anything and rank by the total. Points hide the real numbers. A tech should be able to look at the board and know his close rate without doing math.
Pick the period on purpose
The TV Leaderboard lets you pick current month, last month, year to date, or last 30 days. Each one does a different job.
Current month is for competition. Everyone starts at zero on the first and the arrows move every day. Year to date is for the standard. It shows who your best tech is over the long run, and it is the view to use when you set next year's goals. Last 30 days is for a new tech. It shows his recent work without the slow first weeks dragging the average down.
Most shops leave the TV on current month and check year to date in the owner dashboard once a week. You or your service manager enter each tech's numbers daily or weekly. The board updates within a minute of each entry.
The board shows the score. The dashboard shows the gap.
The leaderboard tells the techs where they stand. It does not tell them where they should be. That is the owner dashboard's job.
In SOS Lite you set a close rate, average ticket, and maintenance plan goal for each trade, so your HVAC goals and your plumbing goals can be different numbers. Every number on the owner dashboard turns green or red against that goal. The board and the dashboard read the same KTI entries, so when a tech's close rate goes red on your screen, you already know whose name to look for on the TV.
If you have not set up the board yet, start with the free TV Leaderboard and pair it to the shop TV this week. The numbers above are already on it.

Related questions
Can I customize leaderboards for sales reps and techs differently?
In SOS the board shows the same five columns for every tech, grouped by trade. You pick the period, not the columns. Tools built to customize leaderboards for sales floors let you rank by any point total, which is the problem this article is about. Comfort advisors are set up as a tech type in SOS and rank inside their trade with the service techs.
Do plumbing, HVAC, and electrical techs rank against each other?
No. The TV Leaderboard groups techs by trade and ranks inside each group. Your plumbers rank against your plumbers, your HVAC techs against your HVAC techs, and your electricians against your electricians. A shop that runs two or three trades sees a separate section on the screen for each one.
Should service and install techs be on the same board?
Install and service techs in the same trade rank together today. Read the board with that in mind: an HVAC install lead will sit near the top on revenue, so look at close rate and maintenance plan rate to compare him with the service techs fairly.
Why not show callbacks on the leaderboard?
Callbacks are a real number and you should track them. They just do not belong on a public screen. Set a callback goal per trade on the owner dashboard, watch it there, and talk to the tech in private.
How often should a sales performance leaderboard update?
As soon as the numbers change. You or your service manager enter each tech's numbers daily or weekly. The TV Leaderboard refreshes every minute, so a number entered this morning is on the board before lunch. A board that updates once a month is a report, not a leaderboard.