
Revenue & Performance
What's the average close rate for an electrician?
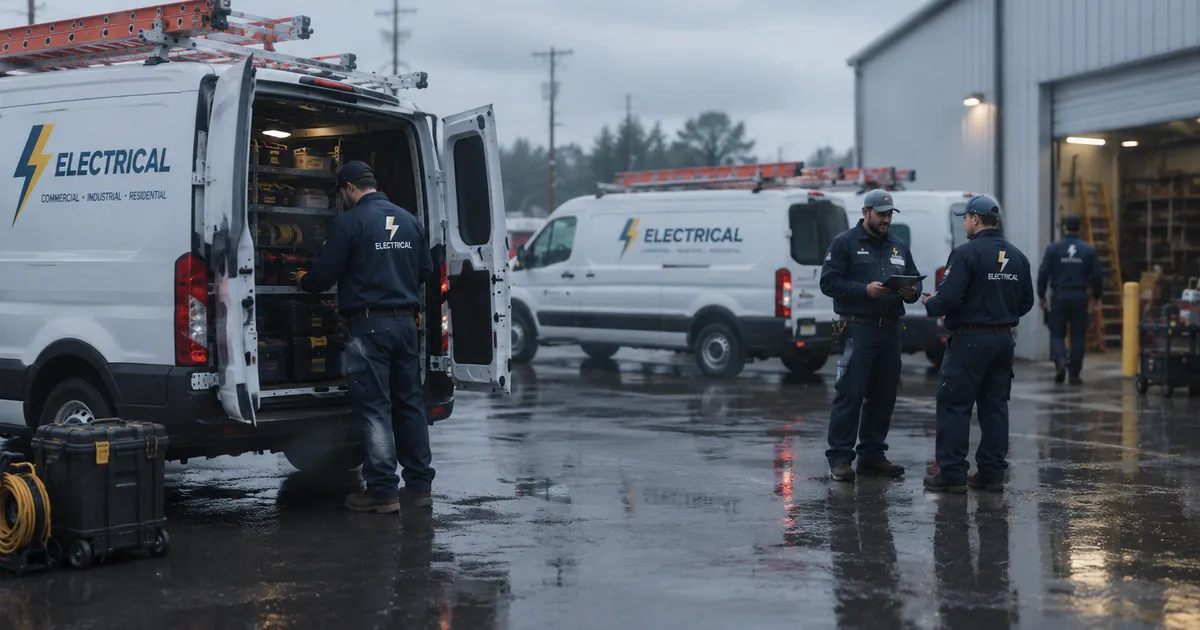
At residential electrical shops that track performance daily, the median close rate is 65.7%. The middle half of techs close between 58.7% and 73.2%. If your techs are closing below that band, the good news is that gap is trainable, and it's worth more than any marketing spend you might be considering.
Why every number you've seen online is different
Search this question and you'll find claims from 15% all the way to 95%. They're not all inherently wrong, but they're measuring different things and calling them the same name.
- Booking rate is what your Customer Service Representative (CSR) controls: calls answered that become scheduled jobs. Industry surveys put electrical booking around the 50% - 75%.
- Close rate is what your tech controls: scheduled jobs that become sold work. This is the important key performance indicator that belongs to the technician standing in the customer's home.
Most articles blend the two, quote a lead-gen vendor's funnel data, and land anywhere. When a stat has no sample size and no definition attached or lacks relevancy to your business, it can't help you set a target.
Our benchmark is a close rate, strictly defined. It is sold opportunities divided by total opportunities, per technician, measured daily. No estimates, no survey answers, just the real job data.
Where the benchmark comes from
The numbers on this page come from technicians at electrical shops that track KTIs (key training indicators) in the Team SPG portal, aggregated over a trailing twelve-month window. Only techs with a meaningful volume of opportunities are counted, and no company's data is ever shown individually.
One honest caveat, and it's actually the point: these are coached shops. Owners here run performance pay, conduct ride-alongs, and monitor daily scoreboards. The median you see above is not the industry average, it's what the industry average can become when a shop starts managing the number. And here we think that's a gap worth chasing.
What moves a close rate
The techs at the top of the band aren't better electricians. They run a better call. The pattern we coach:
- Diagnose out loud. Customers rarely approve services for work when they don't trust your process. Walk them through what you're seeing at the panel, not just the quote at the end.
- Present options, not an estimate. A good-better-best presentation converts more than a single number on a tablet, because it changes the question from "yes or no" to "which one."
- Ask for the work. The most common reason a repairable opportunity walks is that nobody asked. Every presentation ends with a direct question, "which solution would you like me to take care of today".
- Track it daily. A tech who sees their own close rate every morning self-corrects. A tech who sees it quarterly argues with the data. A tech that never sees it thinks they are doing a great job.
What we recommend
Don't set your target at the median. Set your target close rate it at the top of the middle band — 73.2% — and manage to individual techs, not the shop average. One tech at 40% hiding inside a decent shop average is a five-figure annual wage leak.
If you don't know your techs' close rates today, that's the first fix. You can't coach a number you don't collect.
58.7%
Electrical close rate (bottom 25%)
Team SPG coached-shop data · trailing 12 months ending July 2026 · updated Aug 2026
65.7%
Electrical close rate (median)
Team SPG coached-shop data · trailing 12 months ending July 2026 · updated Aug 2026
73.2%
Electrical close rate (top 25%)
Team SPG coached-shop data · trailing 12 months ending July 2026 · updated Aug 2026

Related questions
Is close rate the same as booking rate?
No. Booking rate measures calls that become opportunity jobs (a CSR metric). Close rate measures opportunities that become sold jobs (a tech metric). Mixing them is the main reason published benchmarks disagree so wildly.
What's a good close rate for an electrical service tech?
The median at coached shops is 65.7%, and the top quartile starts at 73.2%. Below 58.7%, there's usually a process problem, not a personality problem.
How do I improve my techs' close rates?
Track it daily per tech. Have your team present options instead of single estimates. Coach the conversation on ride-alongs. The close rate needs attention as it's the most trainable metric in the shop.
