
Team SPG Help
How Do I Monitor Team Activity in Team SPG?
The Team Activity page shows who is actually using the portal — logins, course progress, document views, webinar attendance, and coaching participation — in one filterable timeline. Filter to a single team member to see their learning progress, or click a category card to focus the timeline on one type of activity.
Overview
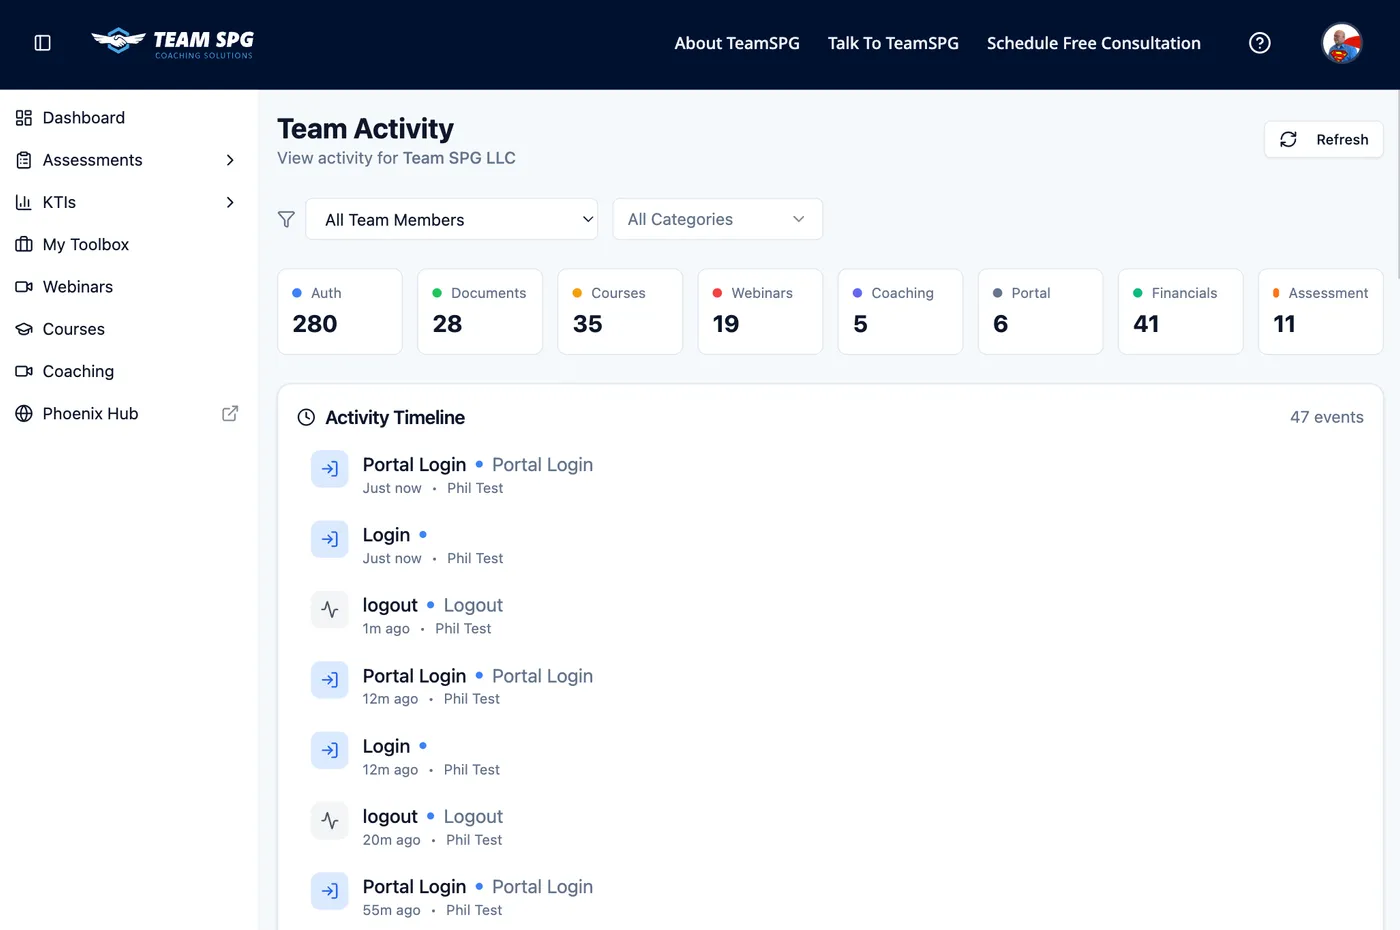
The Team Activity page provides:
- User filtering - Focus on specific team members
- Category summary - Activity counts by type
- Learning progress - Course completion tracking
- Activity timeline - Chronological event log
Who Can See What?
Activity access is role-based:
| Role | Access Level |
|---|---|
| Owner | View all team activity |
| Leader | View all team activity (if enabled) |
| Manager | View own activity + direct reports |
| Technician | View own activity only |
| CSR | View own activity only |
Leaders can be granted full team visibility in Dashboard Visibility settings.
Filtering by User
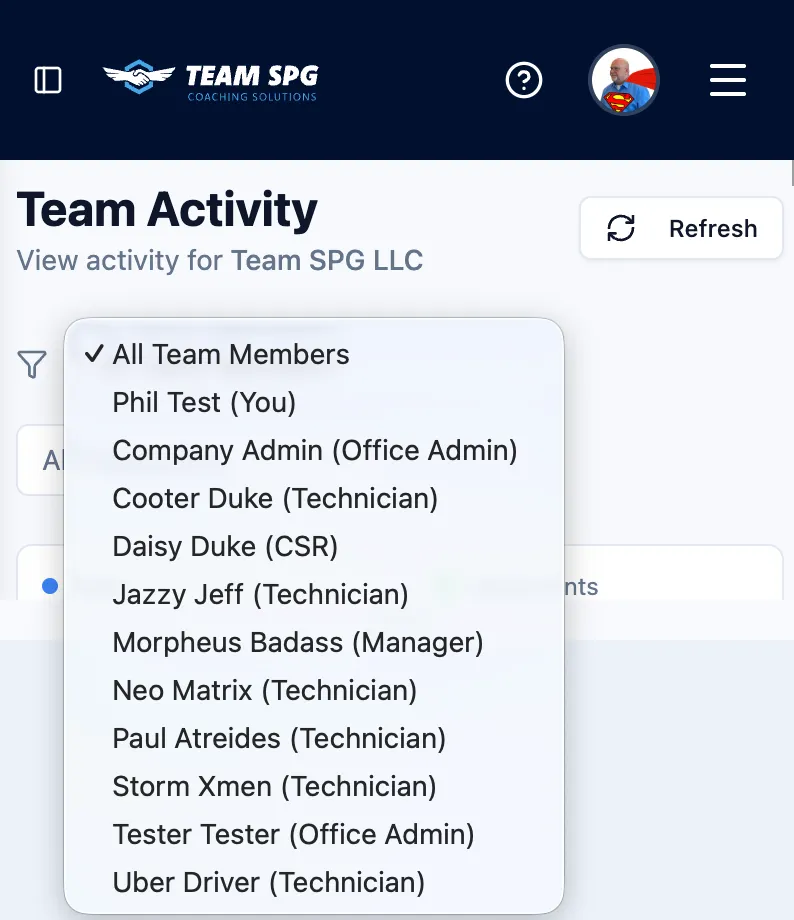
At the top of the page, you'll see a user filter dropdown.
Using the Filter
- Click the dropdown (shows "All Users" or selected user name)
- Options appear:
- All Users - See aggregate team activity
- Individual user names - Select a specific team member
- Type in the dropdown to search for a user by name
- Click a user name to filter
- Page updates to show only that user's activity
What Changes When Filtered
When you select a single user:
- Category cards update to show only that user's counts
- Activity timeline filters to that user's events
- Learning Progress section appears (only visible for single user)
- Page title may update to show user name
When "All Users" is selected:
- Category cards show aggregate counts
- Activity timeline shows all team events
- Learning Progress section is hidden
Activity Categories
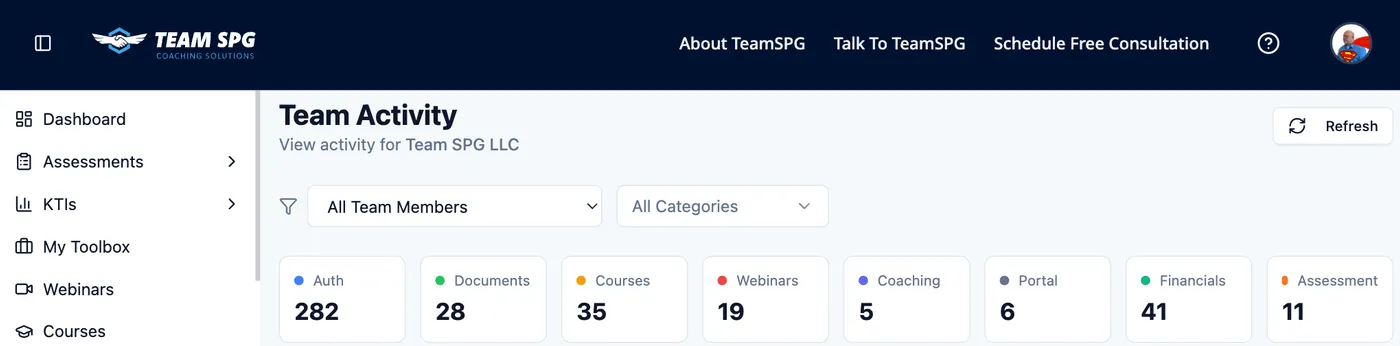
Activity is organized into category cards displayed in a grid at the top of the page.
Category Cards
Each card shows:
- Category name (e.g., "Auth", "Documents", "Courses")
- Count number - Total events in that category
- Card styling - Color-coded by category
Available categories:
| Category | What It Tracks | Icon/Color |
|---|---|---|
| Auth | Logins, logouts, password changes | Authentication icon |
| Documents | File views and downloads | Document icon |
| Courses | Lesson completions, quiz attempts | Course icon |
| Webinars | Webinar registrations and attendance | Webinar icon |
| Coaching | Coaching session participation | Coaching icon |
| Assessment | Assessment completions | Assessment icon |
| Financials | Budget and scorecard views | Financial icon |
| Portal | General portal navigation | Portal icon |
Filtering by Category
- Click any category card
- The timeline filters to show only events in that category
- The selected card may highlight or change appearance
- Click the same card again (or "All" if available) to clear the filter
- Timeline returns to showing all events
Learning Progress
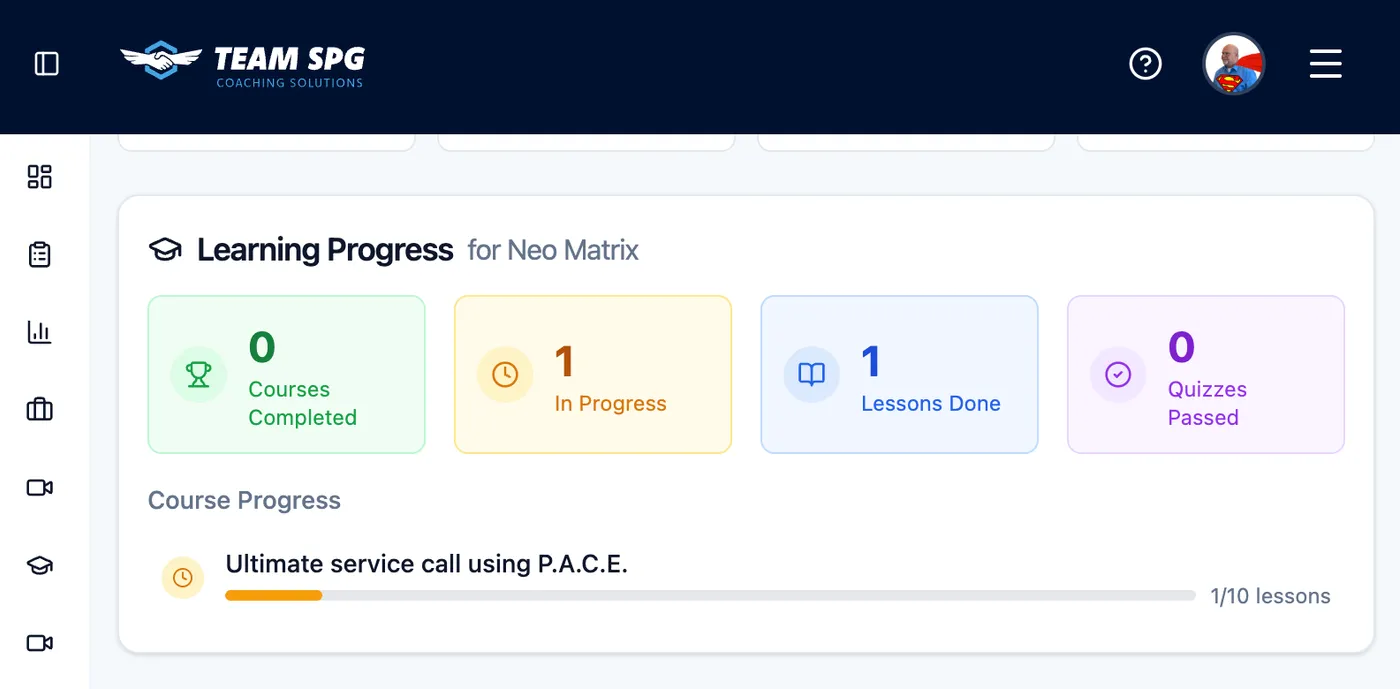
Note: The Learning Progress section only appears when you filter to a single user. It does not display when "All Users" is selected.
Summary Stats Cards
Four stat cards display at the top of the Learning Progress section:
Courses Completed
- Number of fully completed courses
- Displayed in a colored card
- Shows count (e.g., "3")
In Progress
- Number of courses currently being taken
- Displayed in a colored card
- Shows count (e.g., "2")
Lessons Done
- Total number of lessons completed across all courses
- Displayed in a colored card
- Shows count (e.g., "45")
Quizzes Passed
- Total number of quizzes passed
- Displayed in a colored card
- Shows count (e.g., "12")
Course Progress List
Below the stat cards, a list shows each course the user has accessed:
For each course, you'll see:
- Course title - Name of the course
- Progress bar - Visual indicator of completion percentage
- Completion percentage - Text showing "X%" complete
- Lessons completed / total - Format: "X / Y lessons"
- Status badge:
- "Complete" badge (green) - Course is finished
- "In Progress" badge (blue/gray) - Course is ongoing
- No badge - Course not started
Courses are typically sorted by:
- Completion status (in progress first, then completed)
- Or alphabetically by course name
Activity Timeline
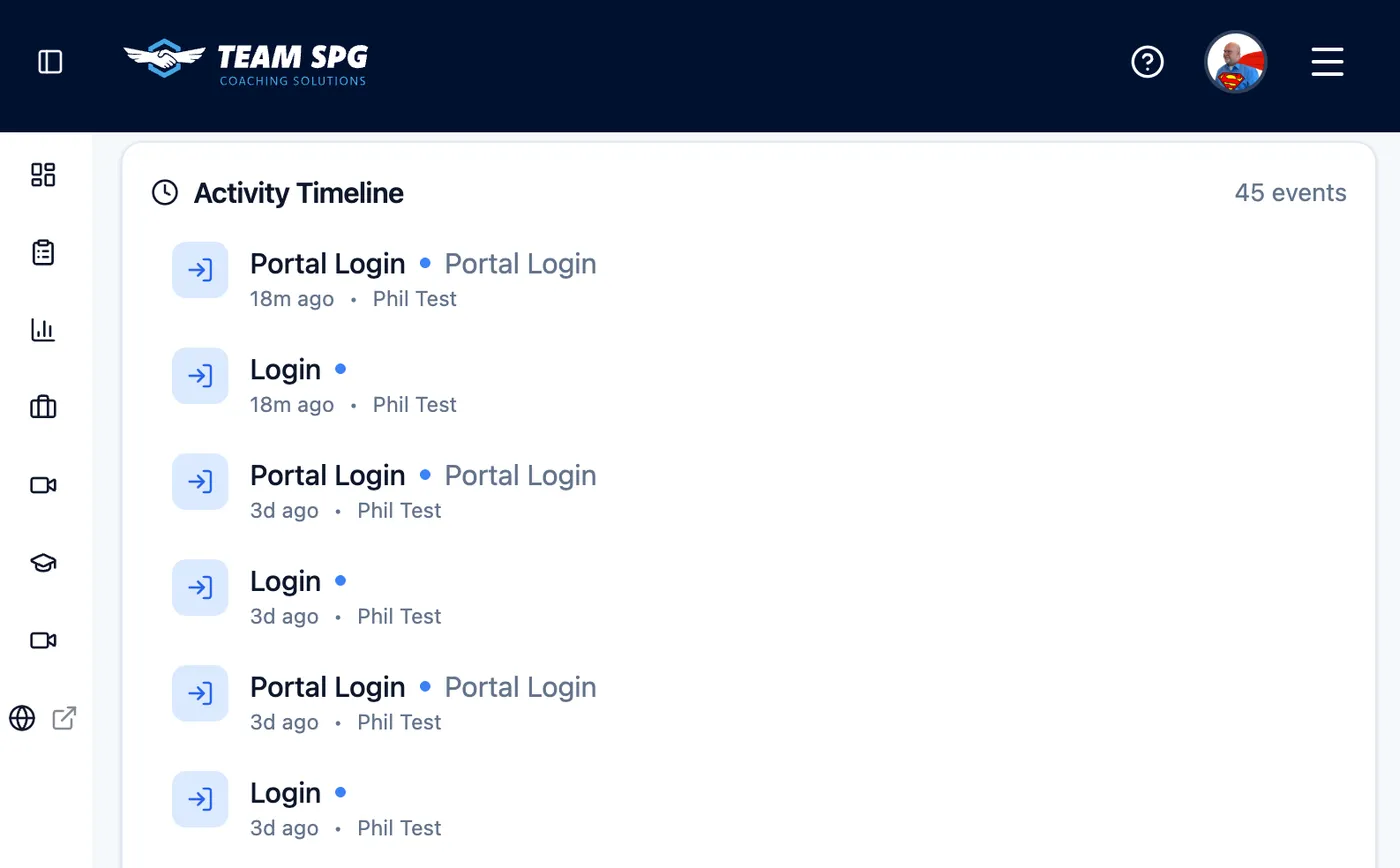
The timeline shows recent events in chronological order (newest first by default).
Timeline Entry Format
Each event entry displays:
- Icon - Visual indicator of event type (varies by category)
- Time - When the event occurred (e.g., "2 hours ago", "Jan 5, 2026 3:45 PM")
- User name - Who performed the action (first and last name)
- Action description - What they did (e.g., "Completed lesson", "Viewed document")
- Details - Specific information:
- Course name (for course events)
- Document title (for document events)
- Webinar name (for webinar events)
- Assessment type (for assessment events)
- Other relevant context
Timeline Features
- Chronological order - Events listed from newest to oldest
- Category icons - Visual indicators help identify event types
- User names - Display first and last name (not WordPress username)
- Relative time - Shows "X hours ago" for recent events
- Absolute time - Shows full date/time for older events
Pagination
At the bottom of the timeline, you'll find pagination controls:
- Page numbers - Click to jump to a specific page
- Previous/Next buttons - Navigate between pages
- Page size selector - Choose how many events per page (e.g., 10, 25, 50, 100)
- Page indicator - Shows "Page X of Y"
To navigate:
- Click page numbers to jump to that page
- Click "Previous" to go back one page
- Click "Next" to advance one page
- Change page size to see more/fewer events per page
Using Activity for Coaching
Team Activity helps identify coaching opportunities:
- Low engagement - Users who haven't logged in recently
- Course struggles - Courses with low completion rates
- Active learners - Recognize high performers
- Training gaps - Identify who needs specific courses
Accessing Your Own Activity
All users can view their own activity:
- Click your profile icon in the top right
- Select Activity from the dropdown
- View your personal activity timeline
Frequently Asked Questions
What counts as activity?
Logins, document views and downloads, lesson and quiz completions, webinar registrations and attendance, coaching participation, assessments, and financial page views — every event is timestamped and categorized.
Why can't I see my team's activity?
Access is role-based. Managers automatically see their direct reports; leaders need "Team Activity" enabled in Settings > Dashboard Visibility. Technicians and CSRs see only their own activity.
Where is the Learning Progress section?
It only appears when you filter to a single user. Select a team member in the user dropdown and their courses, lessons, and quiz stats display.
Related Topics
- Courses & Learning - Manage course assignments
- Coaching Sessions - Schedule coaching
- Settings - Configure visibility permissions